Animated Graph Template for PowerPoint
Last updated on August 23rd, 2024
When making graphs for presentations one of the biggest issues a presenter has to deal with is to make the data easy to grasp and also to ensure that the audience can be kept attentive. Slides with graphs can hold important data but are also most likely to be ignored by the audience. You can however make your graphs more interesting by using a PowerPoint graph template.
Animated Assorted Graph Slides Template for PowerPoint
The presentation template contains a bar chart animation in PowerPoint which helps you create graph slides with visually appealing graphics and that play out with animations to help you deliver essential details more effectively.

Construct Graph Slides Which Play in a Sequence
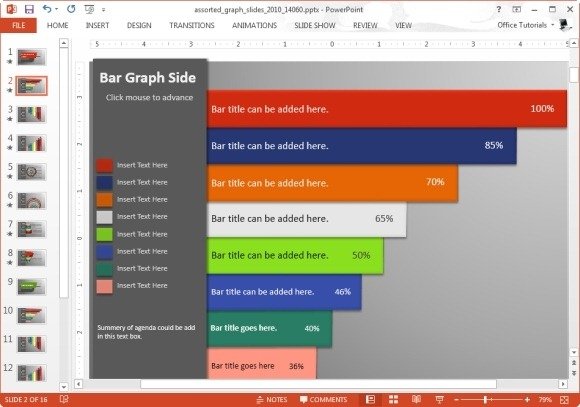
With this template you can display different parts of a graph one by one. For example, you can enter statistics in the readymade graph slide, which will display each part of the graph one by one during a presentation. This can help you present each aspect of your graph in a set sequence; such as by starting to show a piece of data by playing out one bar (from a bar chart) after the other.

Create Slides Using Multiple Sample Graphs
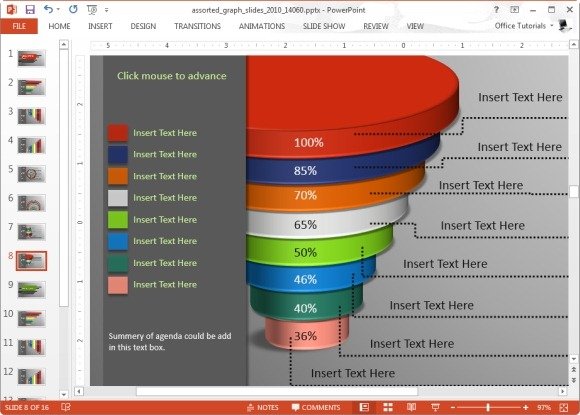
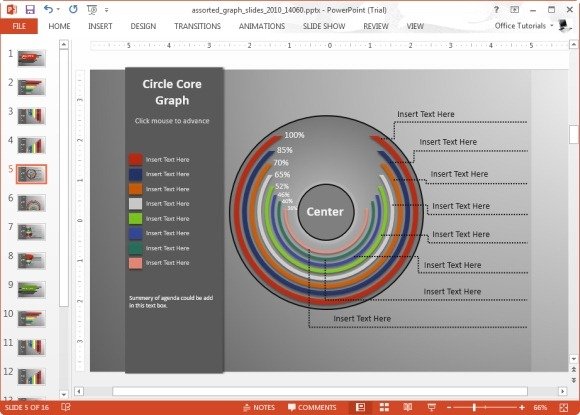
The template offers multiple sample graph slides with different types of graphs, ranging from the very common bar charts to the very complex core graphs.

Each sample chart comes with various placeholders for entering relevant data, to help further elaborate different parts of each graph. These placeholders can be easily dragged around the slides or removed as per requirement.
The given placeholders can play an essential role in displaying the different core details of your presentation topic and slides; be it information about a financial quarter, a research survey or consumer response for a product.

Animated Assorted Graph Slides Template has versions available for:
- PowerPoint for PC
- PowerPoint for Mac
- Keynote for Mac and iPad
