3D Charts for PowerPoint Presentations
Decorating your PPT slides with nice 3D charts can be really helpful to impress your audience in any business PowerPoint presentations. However, designing 3D charts may not be straightforward even for savvy PowerPoint users. There are many different situations when a 3D chart can tell more than a 2D design. Here we will see some alternatives to make 3D Charts and plotting in 3D.
Archimy – Plot Complex Math Functions and 3D Charts
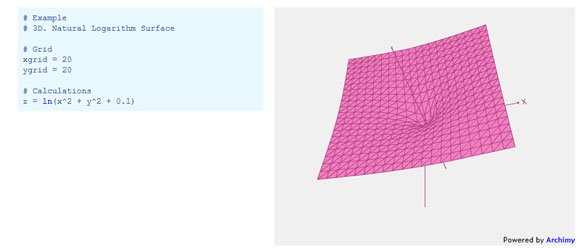
You can try to design 3D charts online with tools like Archimy. This free online tools let you design complex 3D charts for example 3D Natural Logarithm Surface plots, like the following example.

UPDATE: This service is no longer available as a tool.
You can control the viewport using your mouse, so you can rotate the chart dynamically. Archimy is a service for drawing the graphs of all kinds of functions.With Archimy, you can draw the graph of any function and form, just use your imagination and then control the viewport. You can define a graph by specifying the formula for the coordinates x,y,z. The syntax does not differentiate between commands written with lowercase and uppercase letters. You can type commands in one line using “;” as a delimiter and “#” character for comments. See an example here: 3D Natural Logarithm Surface.
AmCharts – Animated and Dynamic 3D charts
AmCharts has a nice Chart Visual Editor that helps to create settings and data files suitable for Flash charts (bundle and stock).

It won’t produce code if you are working with JavaScript charts only but if you need to use these 3D charts in PowerPoint presentations then you can take screenshots, for example using tools like Greenshot.

Other free 3D chart alternatives online
Alternatively you can use ChartGo as a free online service to make 2D and 3D charts. Maani.us has a nice gallery of 3D charts that uses XML.
CrystalGraphics.com PowerPlugs 3D Charts
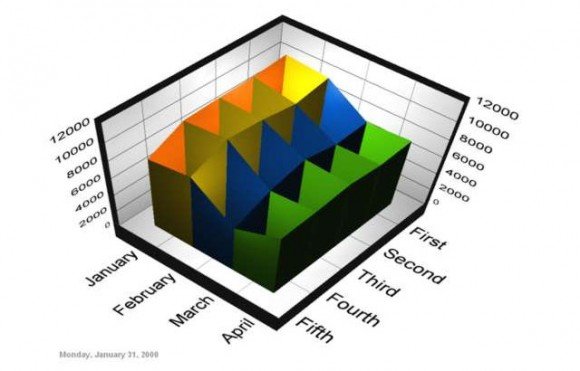
You can download 3D graphics and charts from CrystalGraphics that are suitable as generic 3D Charts for any business presentation. In this example you can access Flow Diagrams, 3D Objects, 3D Lists and more.

Here is another example of 3D Chart with surface created with Crystal Graphics.

Create 3D Charts in PowerPoint
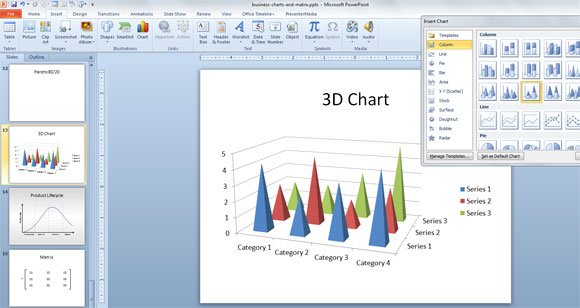
Of course you can also create 3D charts in PowerPoint and insert them in your slides. This will integrate Excel with PowerPoint in order to combine the power of Excl spreadsheet and the presentation software PowerPoint to show the generated 3D charts and graphics. PowerPoint can be used to make impressive 3D Charts for example the following stacked pyramid 3D Chart example.

PresenterMedia’s 3D Charts for Presentations
Another good alternative to download awesome 3D chart for presentations is from PresenterMedia. The subscription based service that allows you to download unlimited PPT presentations and PowerPoint templates with stunning animations and illustrations to make effective presentations in Microsoft PowerPoint or Keynote.

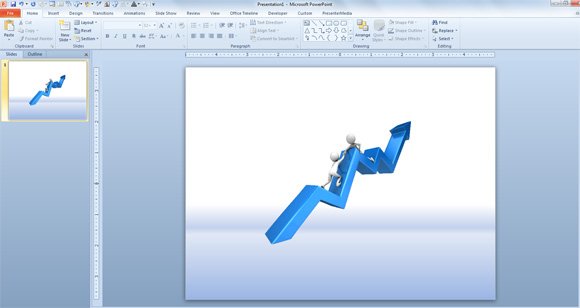
If you choose to download a clipart then you can embed it in a PowerPoint presentation slide.

Download Help me Up the Graph Clipart for PowerPoint from PresenterMedia.
