10 Startup Strategies Inspired by Japanese Lean Manufacturing Techniques
Last updated on April 22nd, 2024
Present world is full of numerous tools that prove to be beneficial for learning effective management skills. Having adequate knowledge about the procedure for putting these start-ups into use is more important than just having a brisk idea of utilizing them. Coming section is aimed at providing a brief overview about top ten start-up strategies that were inspired in lean manufacturing concepts, normally brought to you by Japan companies in ’80s, like Toyota.
1. Pareto Chart
Vilfredo Pareto introduced an all new 80/20 rule aimed at reducing the gap between the current as well as the targeted product status. His theory motivated people to focus on the top 20 percent factors that retain an individual from achieving his goal.
2. Ishikawa Diagram
Commonly known as fish bone diagram, Ishikawa diagram was introduced by Kaoru Ishikawa in 1960’s. It is categorized under seven QC tools including Pareto chart, histogram, flow chart, control chart, check sheet and scatter diagram. Ishikawa diagram is also known as Fishbone diagram.

It is amongst one of the most flexible tools aimed at conducting root cause analysis for manufacturing or production type processes using 6M(method, man, material, machine, measurement and mother nature) plus 4P(product, price, promotion and place) in order to market sales Kaizen.
3. Ohno Circle
Taiichi Ohno developed a circle with chalk around all the managers and made them stand within them until they had documented all the problems within a particular area. Nowadays, it has become a great way to decide the initiating point for reducing the gap using Pareto Chart theory.

4. Deeming Wheel
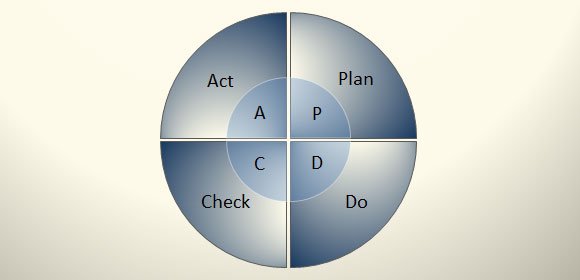
This theory is developed by Edwards Deeming oriented towards PDCA model (Plan, Do, Check and Act).
PDCA (plan–do–check–act or plan–do–check–adjust) is an iterative four-step management method used in business for the control and continuous improvement of processes and products. It is also known as the Deming circle, cycle or wheel; Shewhart cycle, Control circle/cycle, or Plan–Do–Study–Act (PDSA).
Another version of this PDCA cycle is OPDCA. The added “O” stands for observation or as some versions say “Grasp the current condition.” This emphasis on observation and current condition has currency with Lean/TPS literature.
You can make Deeming Wheel diagram in PowerPoint very quickly using PowerPoint Shapes. If you need business charts like this you can download free business charts and graphics templates bundle from this website for free.

5. Gantt Chart
Henry Gantt, a popular management consultant introduced revolutionary Gantt Chart in 1910 with an objective of managing large and complex projects to maintain a proper working balance. You can learn more about Gantt chart templates here.
Here the action plan is not just limited to “plan and do”, rather it aims at “check and adjust/ act theory” taken from PDCA cycle, commonly known as deeming wheel.
6. Taguchi Method
This is amongst one of the most powerful methods to test your ideas through experiments which was developed by Genichi Taguchi.
This experiment is better explained with the help of a bell curve approach providing defective scheme on the basis of a specification limit. Such tools help in proving the worth of your experiment.
7. Maslow’s Hierarchy of Needs
The Maslow´s Hierarchy of Needs theory is basically divided into 5 steps with every step containing a unique need.
Need of Physical survival is the initiating need followed by need of safety and security, need for belonging and love, need for self esteem and recognition, need of self actualization. As your status increases, your needs automatically start increasing.

You can download Maslow Pyramid of Needs Diagram as a free PowerPoint template.
8. Oba Gauge
It is amongst one of the most useful methods to enable a visual workspace for abnormality management which is also known as ‘4 foot rule’ or ‘1.3 meter rule’. This theory was created by 4 feet tall Japanese named Mr. Oba who was unable to see the workplace while standing on the ground.
He created this theory in order to avoid all the view-blockers which is now being used to overcome numerous problems with great ease.
9. Heinrich Principle
This principle is aimed at viewing even the smallest of problems related to safety incidents so as to avoid larger safety mishaps. With this theory, people are vigilant about smallest of errors in which could be dangerous at higher level.
10. Kano Model
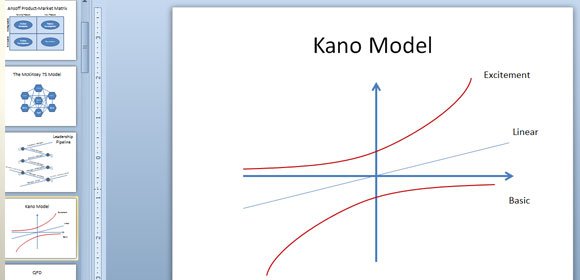
Professor Noriaki Kano gave us a model which is aimed at answering customer requirements. A chart is used to depict all the spoken as well as untold customer requirements. Fact based planning method is being used here.
At the end, it is important to note that first nine tools were aimed at improving quality, safety, delivery plus cost factor. But Kano Model will help you to know about the products and services aimed at imparting exact market advantage. You can make your own Kano Model diagram in PowerPoint using shapes or download our free business templates bundle with Kano diagrams.

In conclusion, the article provides a comprehensive guide to ten innovative startup strategies inspired by lean manufacturing concepts, originally developed by Japanese companies in the 1980s. These tools, ranging from the Pareto Chart to the Kano Model, offer practical approaches to managing quality, safety, delivery, and costs, effectively enhancing business operations. By integrating these methodologies, such as the Ishikawa Diagram, Ohno Circle, Deeming Wheel, and more, managers can engage in thorough analysis, planning, and improvement of processes. Each tool is designed not only to address specific aspects of production and management but also to ensure continuous improvement and responsiveness to customer needs.
Adopting these strategies can significantly boost a company’s efficiency and competitiveness in today’s dynamic market environment. Make use of these tools to manage your business effectively!
